
Purpose
This document gives an overview of the four different Tuva Tools editions Tuva Jr., Elem-middle, Middle, and High. The Tuva Authoring Environment enables both Tuva and its partners to customize tools for their audience. Creators can choose between pre-compiled editions of the tool via the authoring environment. Each edition focuses on data concepts and skills relevant to the concerned grade band. Currently, there are four available presets: Tuva Jr., Elem-middle, Middle, and High. These presets adjust the toolbar to display features suited for the respective school levels. Notably, Tuva Jr transforms the entire data environment to fit the needs of elementary school kids.
How to Use
The four editions are described in more detail below. Scroll down to learn about the distinctions between each edition. Use the chart at the bottom to compare the editions side by side.
Elem-Middle Preset
The Tuva Jr. edition is activated using a radio button under Presets.
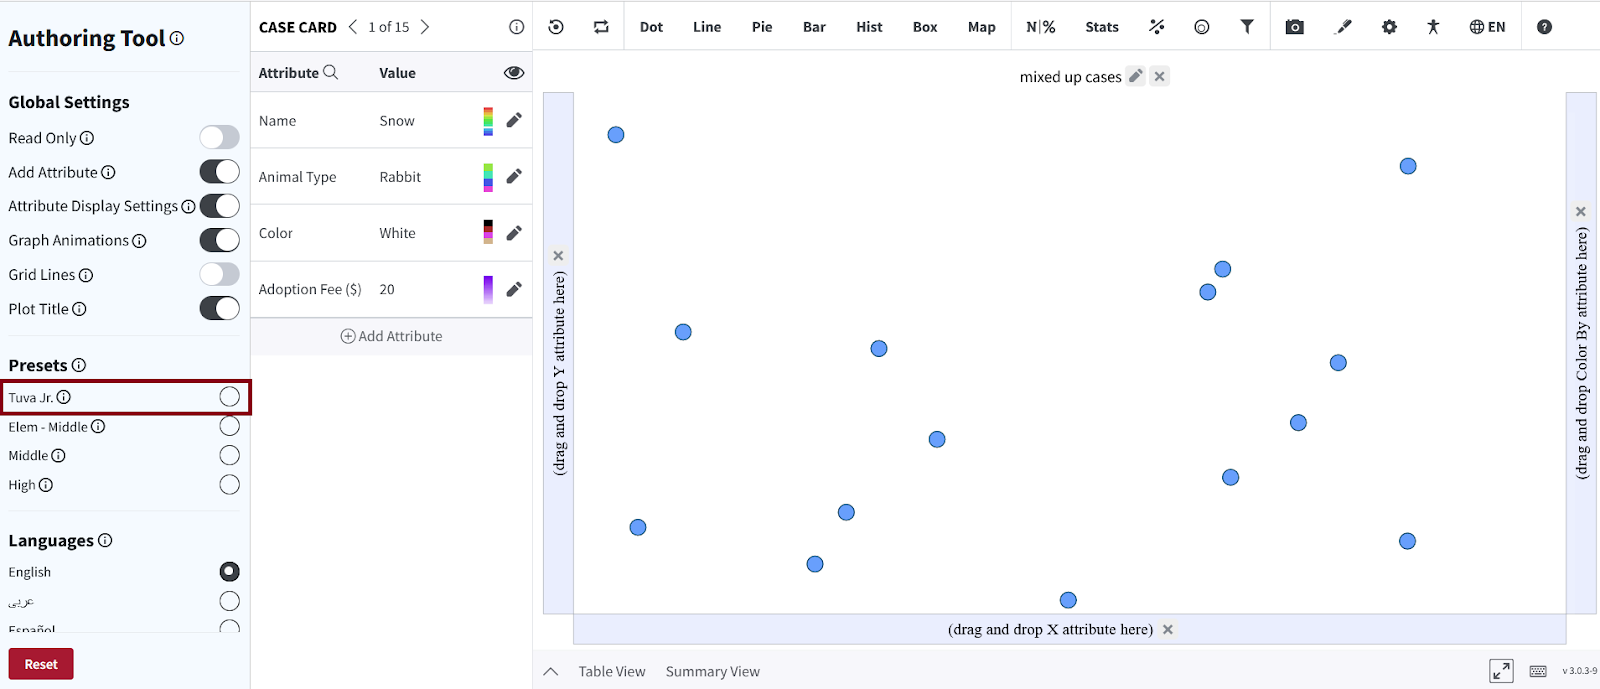
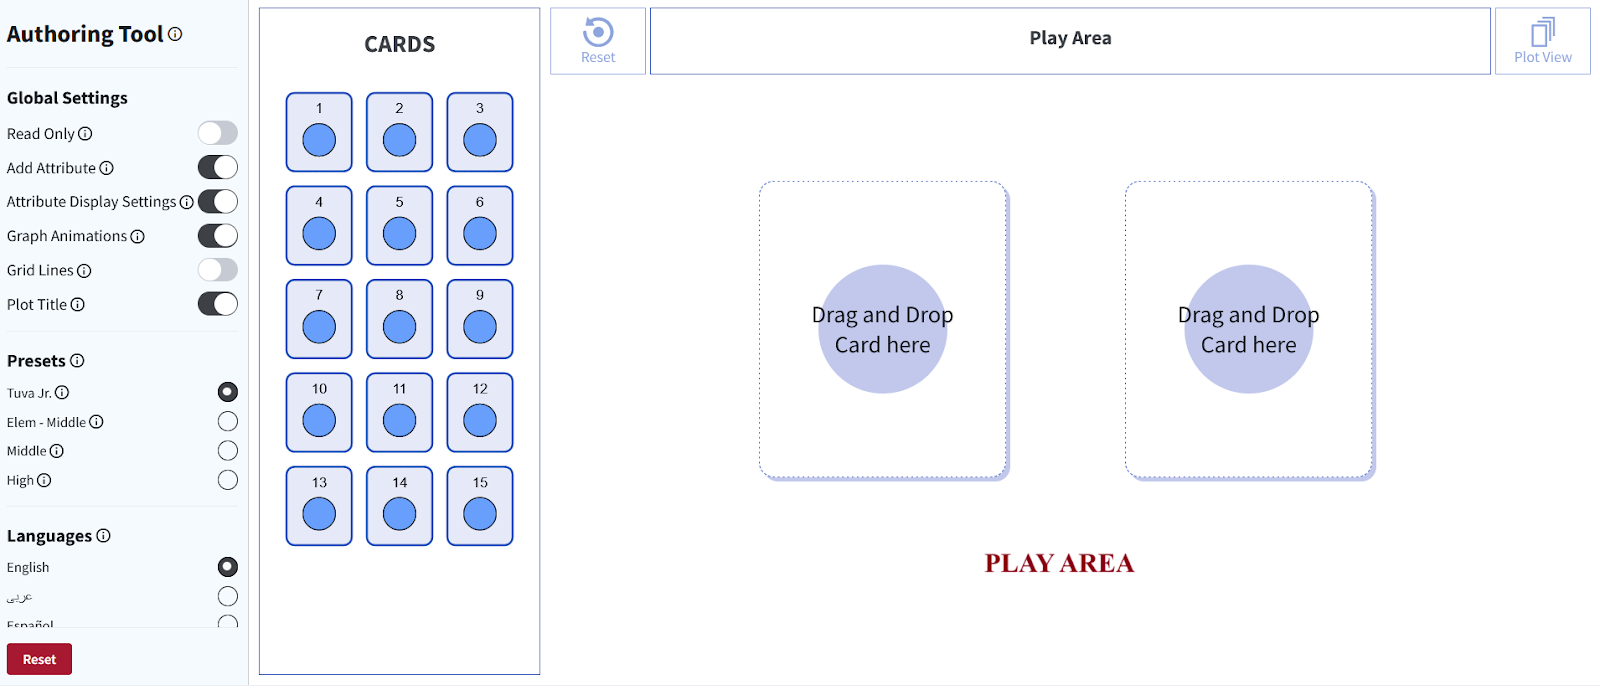
The default view for Tuva Jr, is the PLAY VIEW. This view leverages the metaphor of a card game that involves dragging and dropping cards into the Play Area and sorting attributes.
Thus, Tuva Jr. defines a marked pedagogical shift in design based on research that indicates several aspects of the Middle School edition of the Tuva Tools that could potentially pose challenges for very young children such as the initial random state of cases, the CASE Card view, and the toolbar.
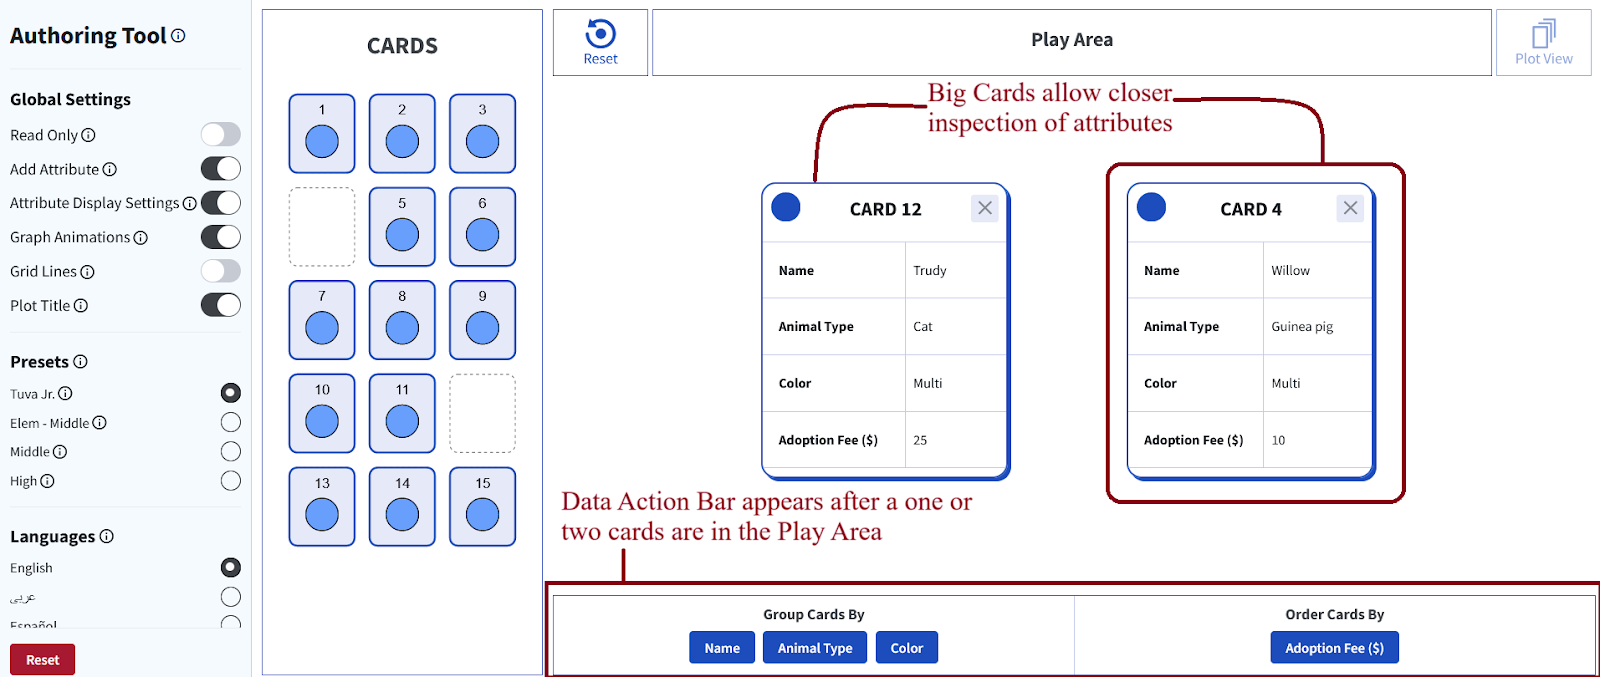
Elements in the Play Area appear step-by-step. After placing a Card, the bottom data action bar appears. Sorting cards by attributes triggers the top toolbar. This gradual introduction approach reduces cognitive load and streamlines options, preventing overwhelming choices for young learners.
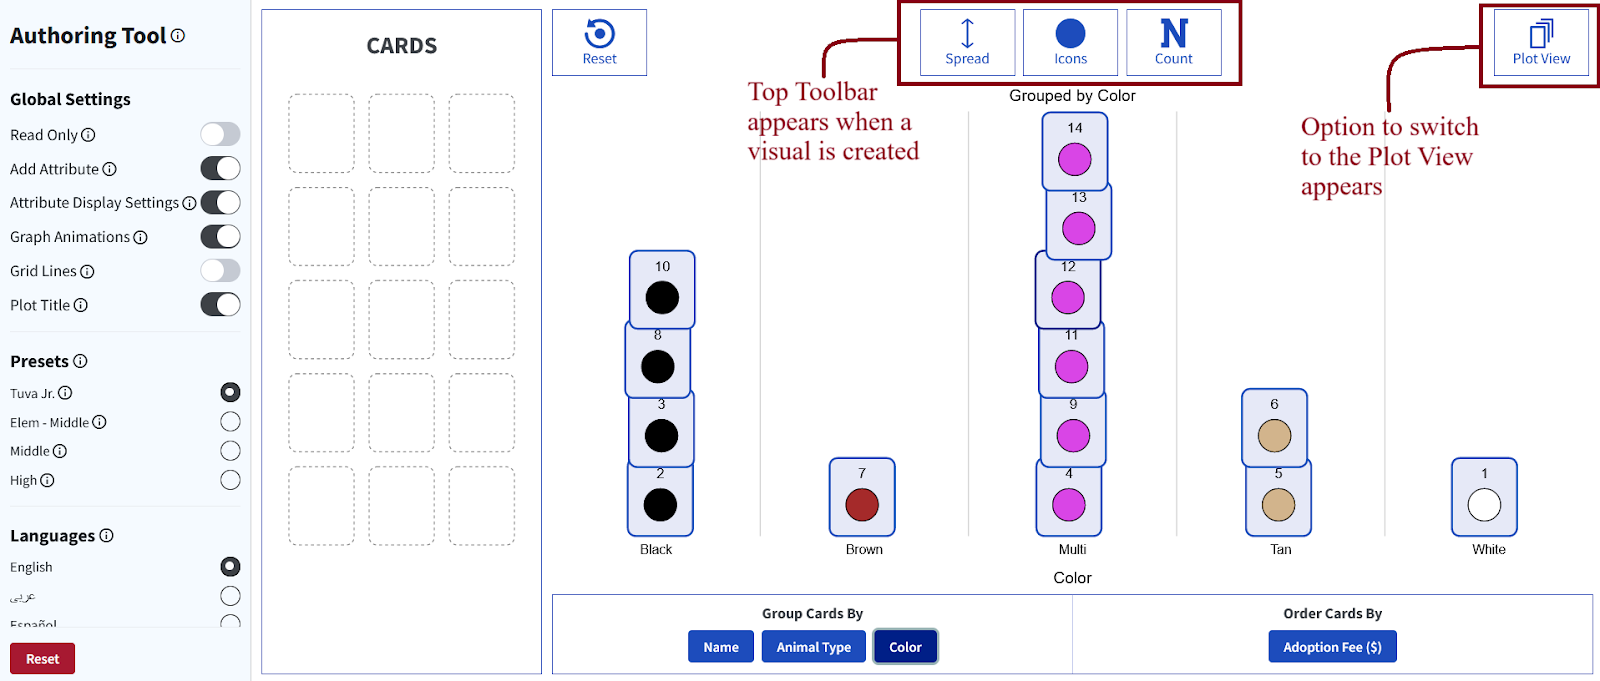
The environment is uncluttered for ease of use.
Similarly, the Plot View in Tuva Jr. has fewer, bigger icons with larger fonts. All the icons used are visually meaningful to children.
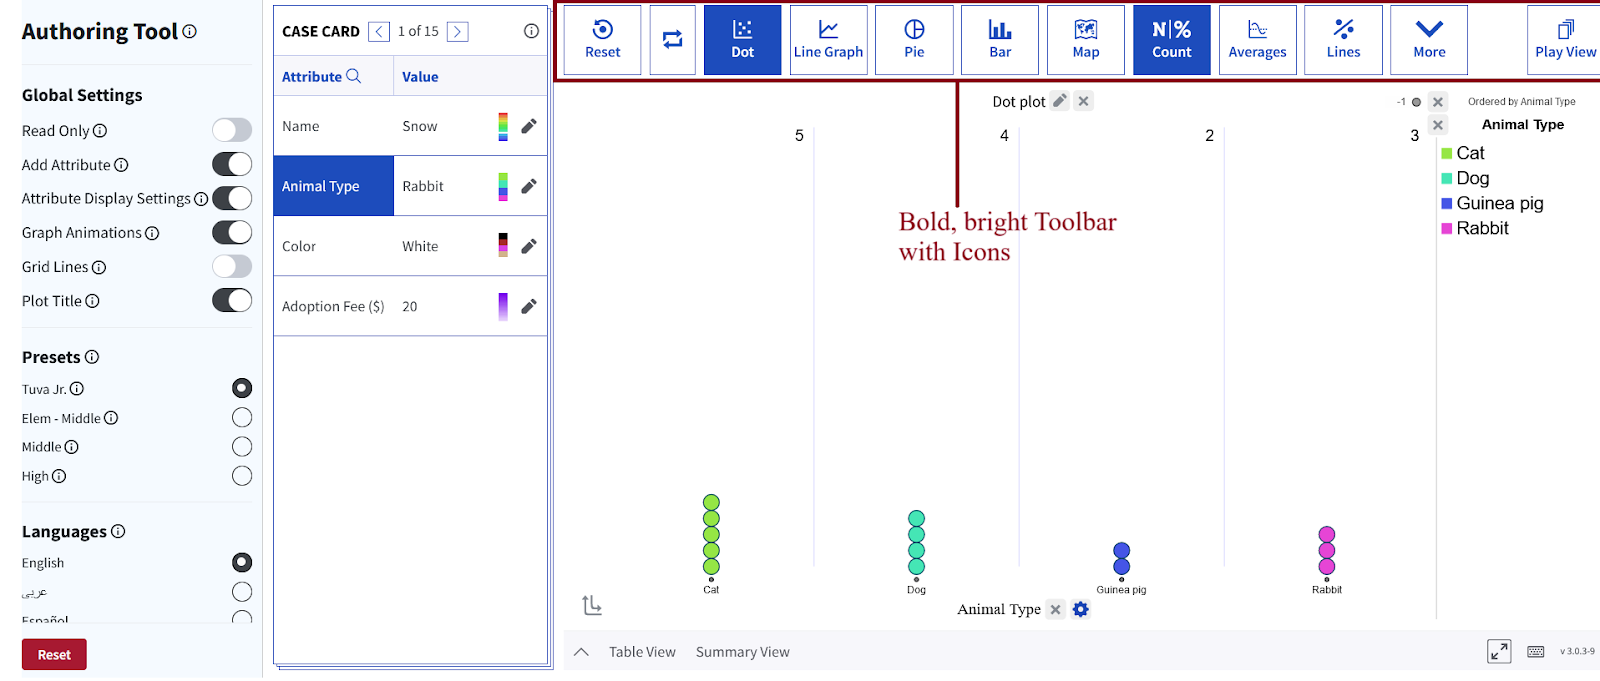
Thus, Tuva Jr. learners progress from the engaging PLAY view to the more intricate plot view.
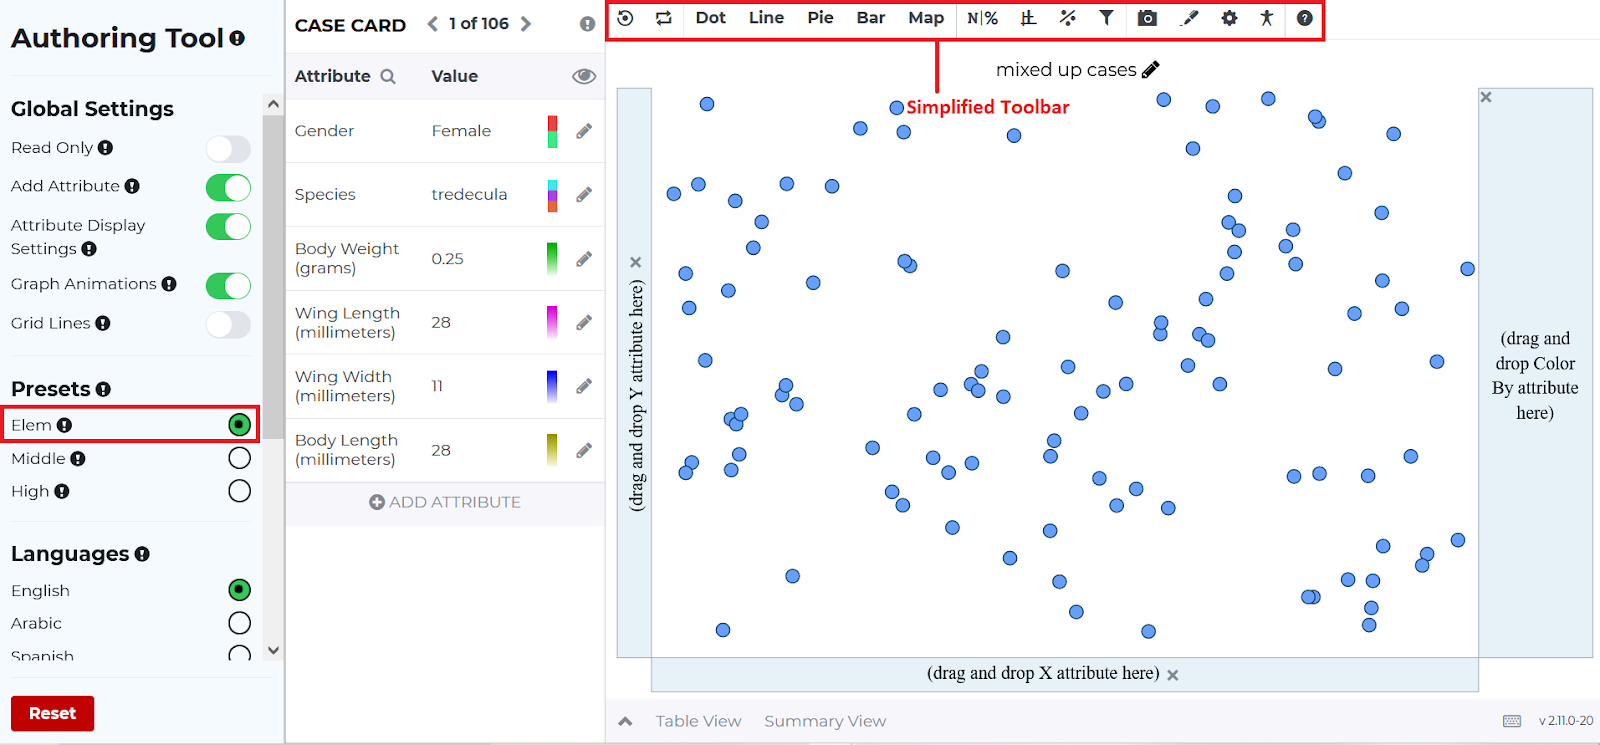
Elem-Middle Preset
This mode is meant to cater to students transitioning from elementary school to middle school. Most toolbar menu items are hidden; the idea is to reduce the complexity of the graphing environment so that students can focus on concepts essential to their level. Further, each submenu in the toolbar has fewer options. For example, the Model Data menu only offers the Movable line. The Least Squares Line and the f(x) functionality have been removed.
Middle Preset
This mode is meant to cater to students in middle school. Most toolbar menu items are available, and the submenus have more options as compared to the Elem-Middle edition.

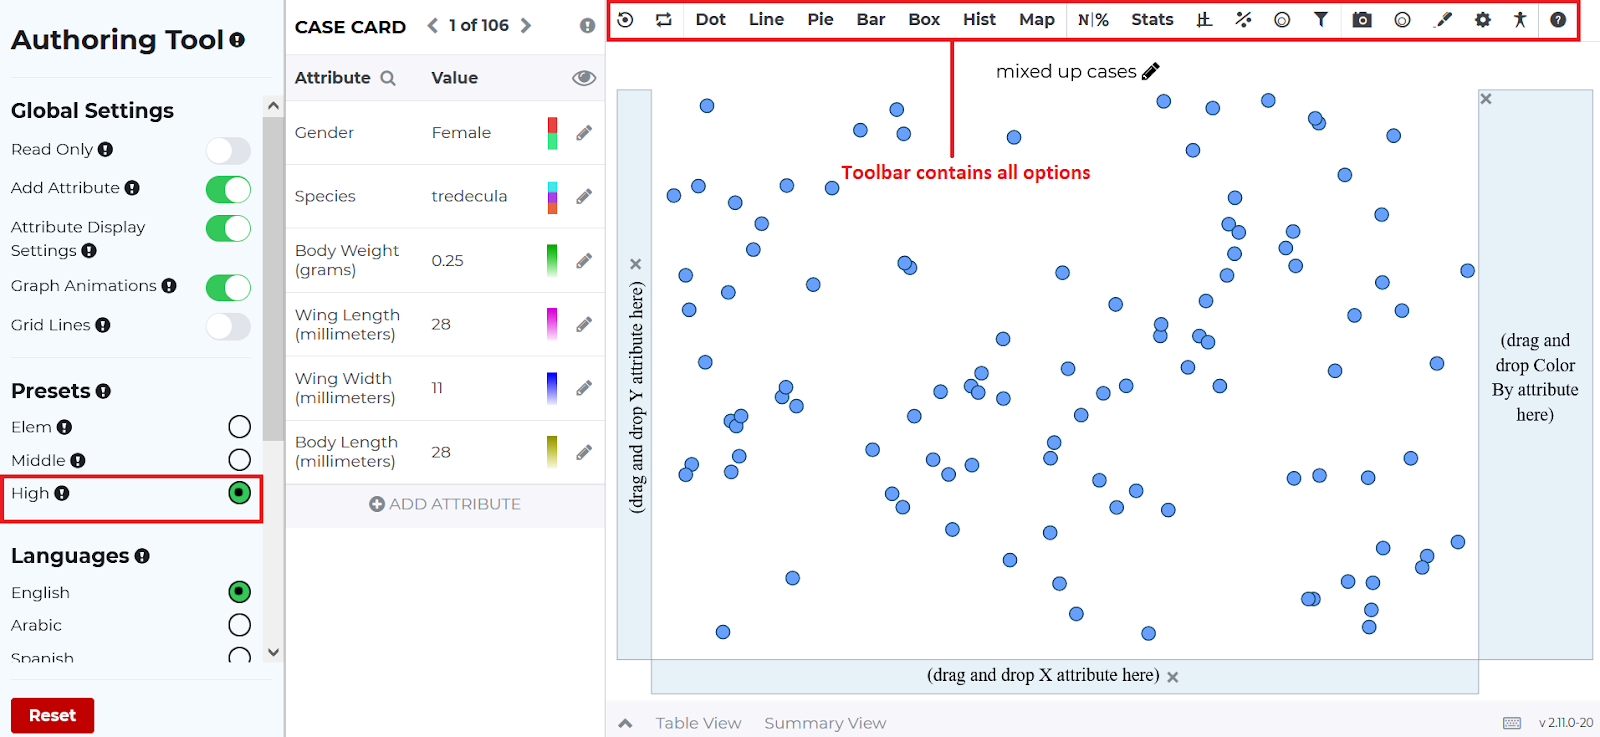
High Preset
The toolbar menu shows all options, and this mode is meant to cater to students in high school.
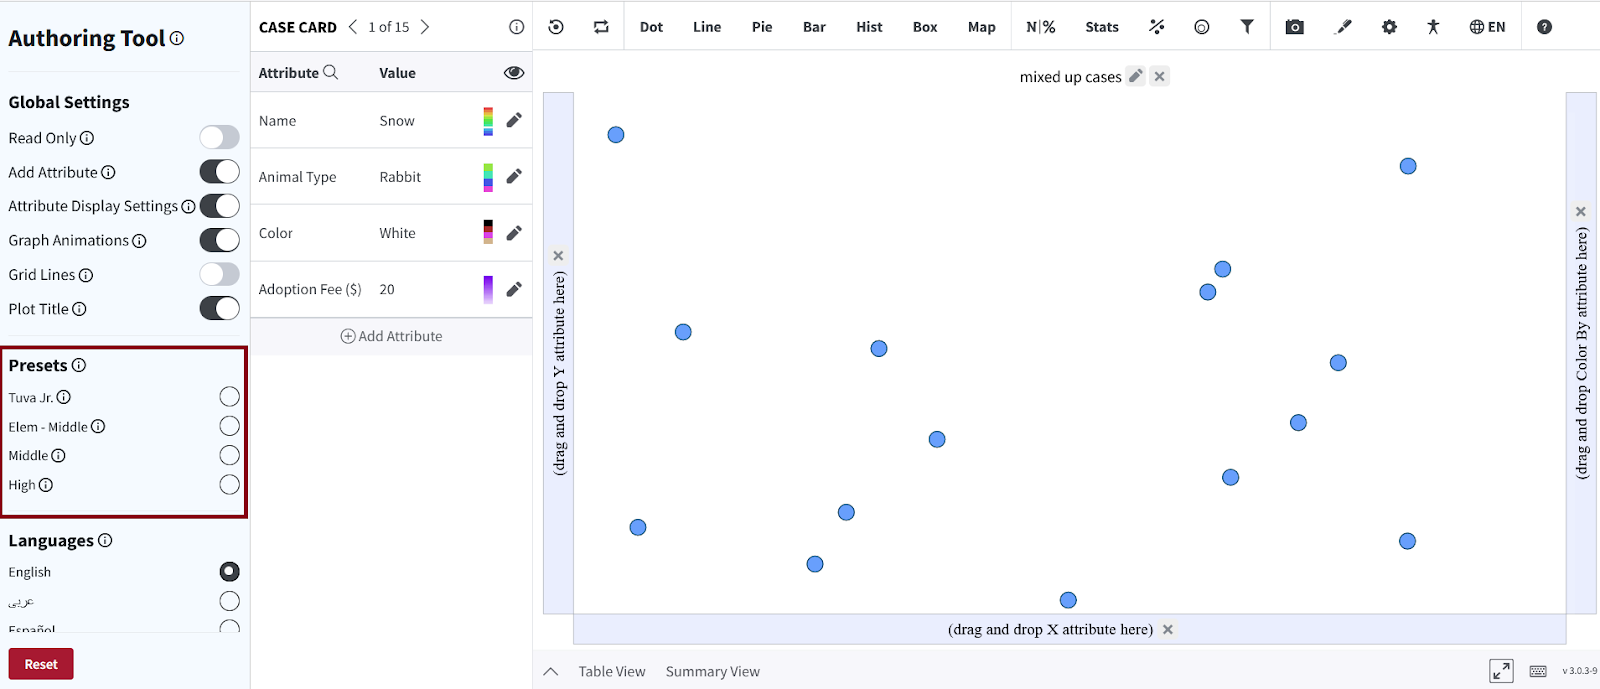
Side-by-side Comparison
Here’s a quick snapshot of how the four editions compare in terms of concepts and skills:
| Tuva Jr. | Elem-middle Mode | Middle Mode | High Mode |
|
Ask simple questions of data (about individuals in a group or a single attribute) Read and describe an individual card of interest Compare two case cards (by comparing one or more attributes) Understand that each card/icon represents a single individual or event Differentiate between categorical and quantitative attributes Estimate number of cards in a category by stacking and subitizing Compare categories using the count function Express the count of a given category as a part of the whole, that is, as a fraction Compare attributes with fractional or decimal values Find the minimum and maximum values for the attribute chosen to order the cards Informally describe the range of values for the attribute Identify the value that has the highest frequency Begin thinking about what is typical of a group Describe rudimentary associations between two quantitative attributes Read and interpret ordered pairs in a scatter plot |
Display Numerical Data in Elementary Dot Plots & Bar Charts of Values to explore min/max values, extreme values, and range of data Display and Read Data in Scatter Plots & Line Graphs to explore trends and associations informally Display and Read Aggregated Data in Bar Charts of Frequencies, Pie Graphs & Stretched Bar Charts Build familiarity with Axis Scale & Create Scaled Intervals
Manipulate data by filtering and dragging categorical attributes Display data in Maps to Build Familiarity with Spatial Distributions |
Elem-middle Mode+ Create and interpret distributions of data using dot plots, box plots & histograms Compare Groups using parallel dot plots, parallel box plots, & parallel histograms Describe and interpret associations between Categorical attributes using Dot Plots & Two-way Tables Describe Distributions using Mean, Median, MAD and IQR Describe the direction and strength of linear relationships using informal tools Use multiple line graphs to represent ordered data and to compare localized and overall trends across locations or categories Model and interpret trends & linear relationships using the Movable line Manipulate Slider Parameters to Fit Linear data Use rates & proportions to compare groups of unequal sizes Create and interpret Bar Charts of Sums and Bar Charts of Means Choose between frequency, relative percentage and relative proportion scales in data displays Generate random samples from populations Generate multiple samples to explore sampling variability Study the effects of sample size on representativeness of the sample |
Middle Mode+ Interpret variability using Standard Deviation (SD) as a measure of spread Establish bimodality using SD Compare groups using standard deviation Use Two-way Tables/Contingency Tables to study conditional probabilities and to establish associations Describe the strength and direction of a linear relationship using the Coefficient of Correlation Use the Least Squares Line for Linear regression analysis Judge the fit of a Linear Model using the Show Squares feature Use the f(x) functionality to model and interpret linear & nonlinear relationships Manipulate slider parameters to fit nonlinear data (quadratic, exponential, cubic, etc.) Use Standard Error as a metric to find the difference from the true mean Visualize and interpret the Distribution of Sample Statistics Explore the Central Limit Theorem Compute z-scores to standardize a distribution Assess the Normality of a Distribution using multiple SDs and z-scores |