Support or Refute? data stories give students a graph and one or more claims to evaluate based on data presented in the graph. Students interpret the graph, or modify it, to decide whether the data support or refute a claim (or neither), and explain the reasoning behind their decision.
Goal: Students evaluate the extent to which provided evidence supports one or more given claims, and explain their judgement call.
|
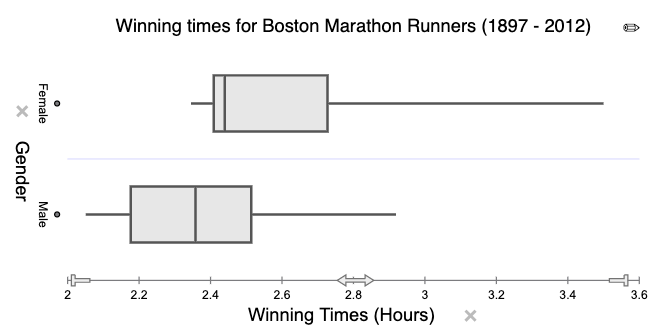
Example: Tuva Data Story Who Tends to Run Faster? Students watch a short video about the first woman to run in the Boston Marathon, and then compare two box-plot distributions of winning times to decide if they support or refute one of three provided claims.
Choose one of the claims and explain how the data either supports or refutes the claim. |
Implementation ideas: Support or Refute? data stories focus on the challenge of “making a call” as to whether or not a given claim (or claims) are supported. What features of the graph support a claim? What features refute it? Or is there no evidence either way? Support or Refute? data stories are also good discussion starters for practicing “productive talk” moves, and for developing compelling arguments.
Related resources:
Keeley, Page, and Tugel, Joyce, 2014. Uncovering Student Ideas in Science (Series), National Science Teachers Association, NSTA Press.
Michaels, Sarah, and Catherine O’Connor. 2015. “Conceptualizing Talk Moves as Tools: Professional Development Approaches for Academically Productive Discussions.” In Socializing Intelligence Through Academic Talk and Dialogue, edited by Lauren B. Resnick, Christa S. C. Asterhan, and Sherice N. Clarke, 347–61. American Educational Research Association.